Understanding the length of daylight throughout the year is essential for many fields, from agriculture and energy management to urban planning and even mental health awareness. Modern technology has made it easier than ever to visualize and track these changes, with LED displays becoming a popular tool for presenting daylight data in a clear and accessible manner. This article explores the concept of length of daylight charts, how LED displays are used to represent this information, and why these tools are valuable for a wide range of applications.
What Is a Length of Daylight Chart?
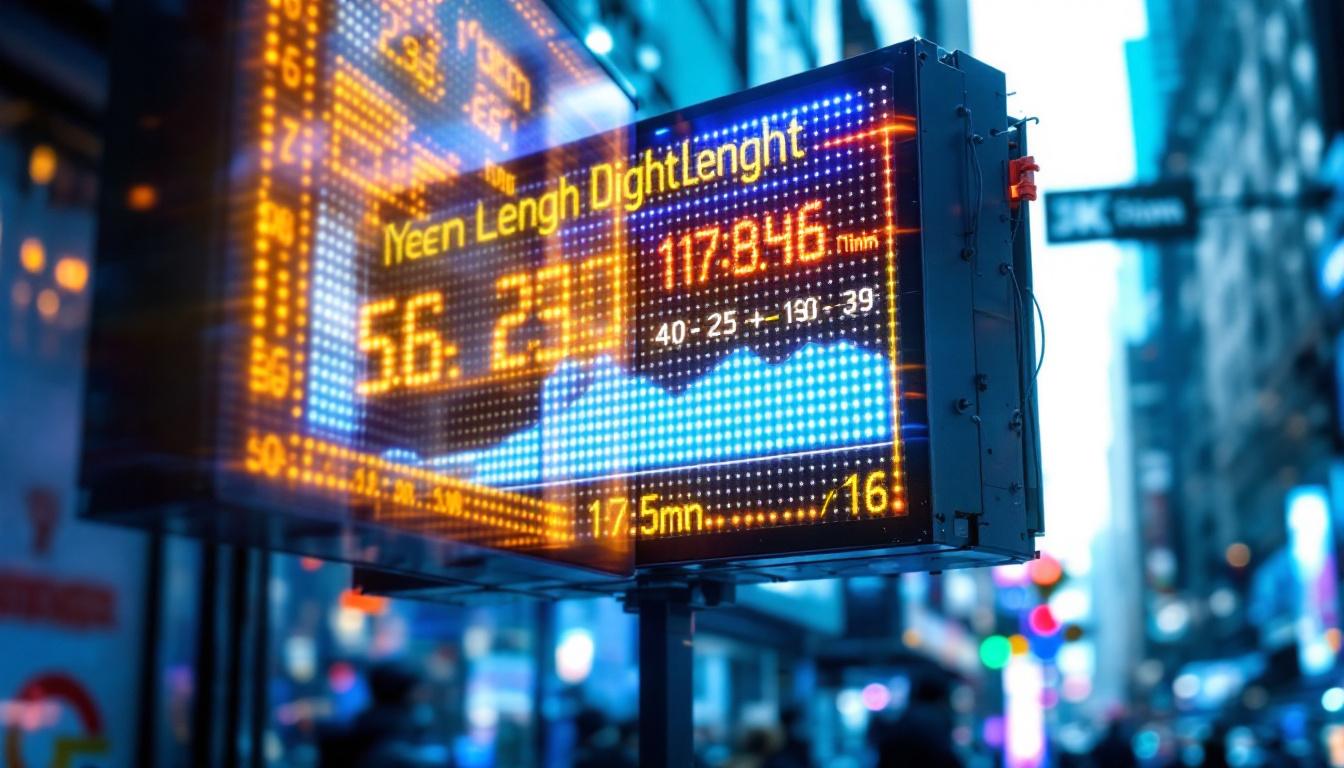
A length of daylight chart is a graphical representation that shows the variation in the amount of daylight over a specific period, typically a year. It illustrates how the duration of daylight changes day by day, reflecting seasonal shifts caused by the Earth’s axial tilt and orbit around the Sun.
These charts often plot the number of daylight hours on the vertical axis against the days of the year on the horizontal axis. The result is a curve that peaks around the summer solstice, when daylight is longest, and dips around the winter solstice, when daylight is shortest.
Such charts are invaluable for understanding natural light patterns, planning outdoor activities, and managing resources that depend on sunlight exposure. They can also be crucial for agricultural planning, as farmers rely on the amount of daylight to determine planting and harvesting schedules. Additionally, these charts can help individuals and businesses optimize energy usage, particularly in regions where natural light significantly impacts heating and cooling needs.
Seasonal Variations and Their Causes
The Earth’s 23.5-degree axial tilt is the primary reason for the changing length of daylight throughout the year. As the planet orbits the Sun, different hemispheres tilt towards or away from the Sun, causing the Sun’s apparent position in the sky to shift. This results in longer days during summer months and shorter days during winter months.
For example, in the Northern Hemisphere, the longest day occurs around June 21st (summer solstice), while the shortest day is around December 21st (winter solstice). The opposite is true for the Southern Hemisphere. Equinoxes, occurring around March 21st and September 23rd, mark points where day and night are approximately equal in length worldwide. These equinoxes are significant not only for their balance of light but also for cultural celebrations and agricultural practices in many societies. For instance, many cultures have festivals that coincide with the equinoxes, celebrating the arrival of spring or the harvest season, highlighting the deep connection between human life and the natural rhythms dictated by sunlight.
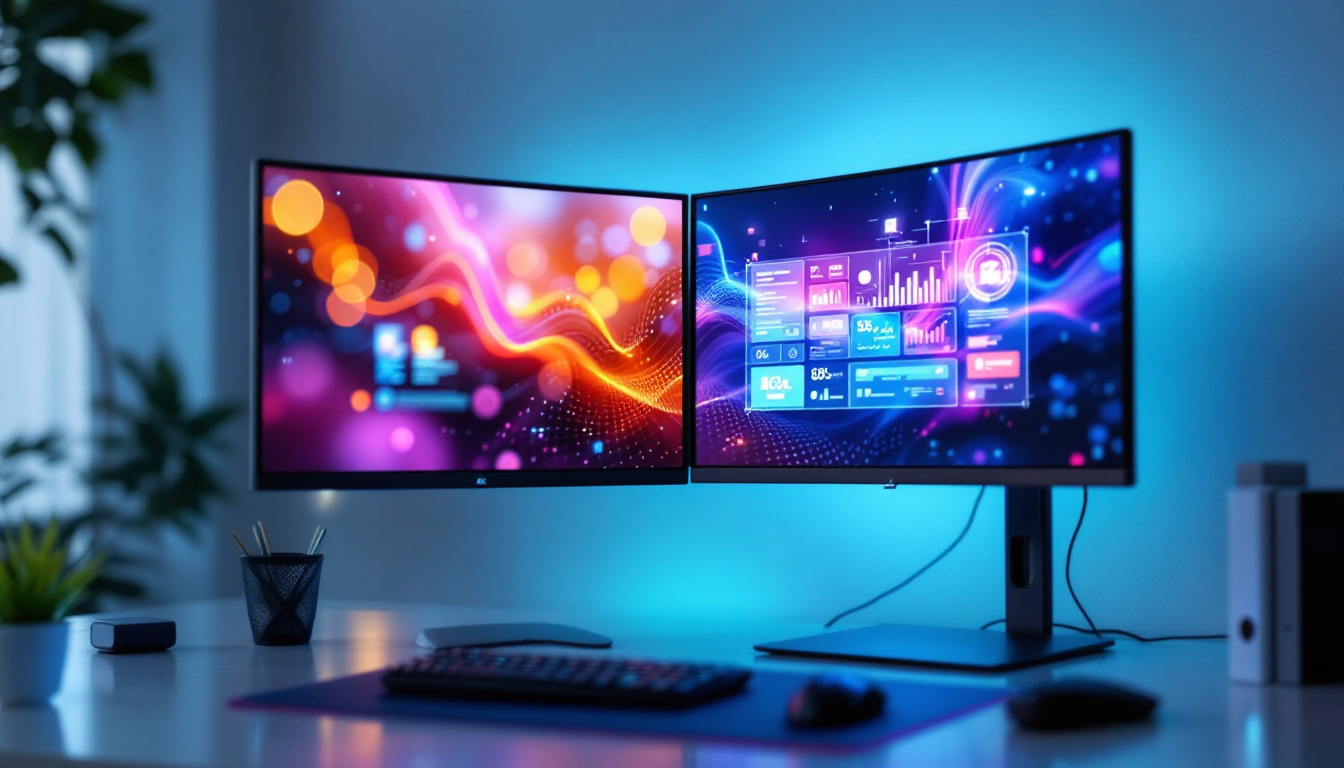
How LED Displays Enhance Length of Daylight Charts
LED (Light Emitting Diode) displays have revolutionized the way daylight data is presented. Their brightness, clarity, and versatility make them ideal for showcasing dynamic information such as daylight duration, which changes daily.
Unlike traditional paper charts or static digital images, LED displays can update in real-time or at regular intervals, providing users with the most current data. This is particularly useful in environments where accurate daylight information is critical, such as agricultural settings, where farmers rely on precise daylight data to optimize planting and harvesting schedules.
Advantages of Using LED Displays
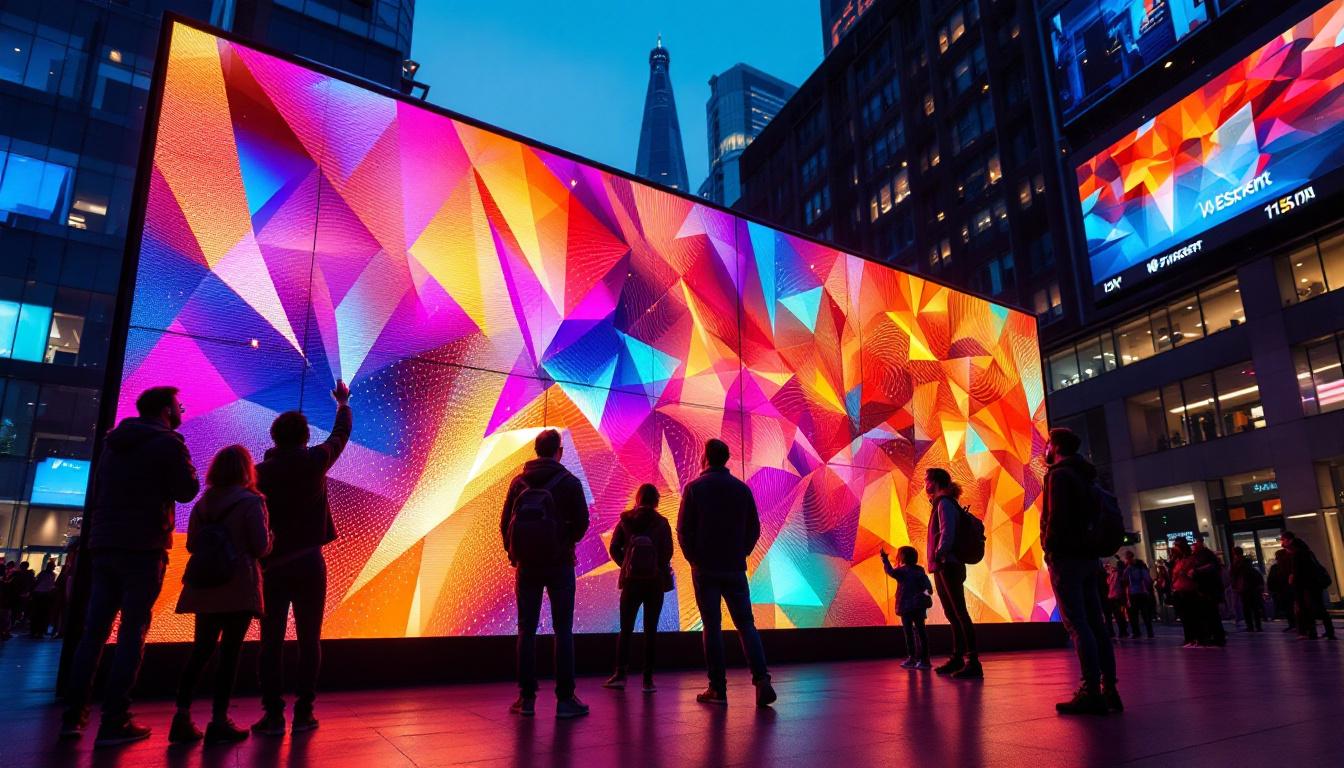
One of the key benefits of LED displays is their visibility in various lighting conditions. Whether indoors or outdoors, LED screens maintain excellent readability, even under direct sunlight. This makes them suitable for public installations such as parks, transportation hubs, and educational centers. In educational settings, for instance, students can engage with real-time data, enhancing their learning experience and fostering a greater appreciation for natural cycles.
Additionally, LED displays can be programmed to show not only the length of daylight but also supplementary information such as sunrise and sunset times, solar noon, and twilight phases. This comprehensive presentation helps users gain a deeper understanding of daily light cycles. For instance, outdoor enthusiasts can plan their activities more effectively, ensuring they make the most of available daylight for hiking, photography, or other pursuits. This level of detail can also be beneficial for urban planners, who can analyze how daylight patterns affect energy consumption and building design.
Energy efficiency is another advantage. Modern LED technology consumes significantly less power than older display types, making it a sustainable choice for continuous operation. This eco-friendly aspect aligns with the growing trend towards sustainability and environmental responsibility, as organizations seek to minimize their carbon footprint while still providing valuable information to the public.
Types of LED Displays Used for Daylight Charts
LED displays come in various forms, from simple numeric panels to full-color graphical screens. For length of daylight charts, two main types are commonly used:
- Segment LED Displays: These are often used to show numerical data such as the exact number of daylight hours or sunrise/sunset times. They are straightforward and cost-effective, making them a popular choice for smaller installations or budget-conscious projects.
- Matrix LED Displays: These allow for more complex graphical representations, including line graphs and color-coded charts. They provide a visually engaging way to track daylight changes over time. Such displays can be particularly captivating in public spaces, drawing attention and encouraging passersby to learn more about the science of daylight.
Choosing the appropriate type depends on the intended use, budget, and the level of detail required by the audience. For instance, a community park may benefit from a large matrix display that can attract families and provide educational content, while a research facility might opt for a more technical segment display that focuses on precise numerical data for scientific analysis. The versatility of LED technology ensures that there is an optimal solution for every context, enhancing the accessibility and understanding of daylight information across diverse audiences.
Applications of Length of Daylight Charts on LED Displays
Length of daylight charts displayed via LED technology serve multiple sectors, each benefiting from accurate and accessible daylight information.
Agriculture and Horticulture
Farmers and horticulturists rely heavily on daylight data to optimize planting schedules, irrigation, and harvesting. Knowing the exact length of daylight helps in planning crop cycles and managing greenhouse lighting systems.
For instance, LED displays installed in agricultural centers or greenhouses can provide real-time updates on daylight duration, assisting growers in adjusting artificial lighting to complement natural sunlight, thereby improving crop yields and energy efficiency.
Renewable Energy Management
Solar energy production depends directly on sunlight availability. Length of daylight charts help solar farm operators anticipate energy generation capacity and plan maintenance activities accordingly.
LED displays showing daylight length and solar position data can be integrated into control rooms, enabling operators to monitor conditions and optimize performance. This is especially important in regions with significant seasonal daylight variation.
Urban Planning and Public Safety
City planners use daylight information to design lighting systems for streets, parks, and public spaces. Understanding when natural light diminishes helps in scheduling artificial lighting to ensure safety and reduce energy waste.
Public safety agencies may also use LED daylight displays in transit stations or public squares to inform citizens about daylight hours, encouraging timely travel and outdoor activities.
Health and Wellbeing
Exposure to natural light affects human circadian rhythms, mood, and overall health. Length of daylight charts on LED displays can be used in workplaces, schools, and healthcare facilities to raise awareness about daylight patterns and encourage behaviors that align with natural light cycles.
For example, displaying daylight duration can help individuals plan outdoor breaks during daylight hours, which is particularly beneficial in regions with long winters and limited sunlight.
Design Considerations for Effective LED Length of Daylight Displays
Creating an effective LED display for length of daylight charts requires careful attention to design elements that enhance usability and comprehension.
Clarity and Readability
The display must present information clearly, avoiding clutter. Using contrasting colors and appropriate font sizes ensures that data is easily readable from a distance. For graphical charts, smooth lines and clear axis labels help users interpret trends quickly.
Update Frequency and Accuracy
Since daylight length changes daily, the display should update at least once per day. For applications requiring higher precision, updates can be more frequent, incorporating real-time solar position data. Accuracy is paramount, so sourcing data from reliable astronomical databases or local weather stations is recommended.
Customization and User Interaction
Some advanced LED displays allow user interaction, enabling viewers to select specific dates, locations, or additional parameters such as twilight phases or solar elevation angles. Customization enhances engagement and makes the display more informative for diverse audiences.
Durability and Environmental Resistance
For outdoor installations, LED displays must withstand weather conditions such as rain, snow, and temperature fluctuations. Using weatherproof casings and materials designed for outdoor use extends the lifespan of the display and ensures consistent performance.
Future Trends in Daylight Visualization Using LED Technology
As LED technology continues to evolve, new possibilities emerge for displaying length of daylight data in more interactive and immersive ways.
Integration with Smart City Infrastructure
Smart cities are increasingly incorporating real-time environmental data into their information networks. LED daylight displays can be linked with other smart systems, such as traffic management and energy grids, to optimize urban living conditions based on natural light availability.
Augmented Reality and 3D Visualization
Emerging display technologies may combine LED panels with augmented reality (AR) to provide users with 3D visualizations of daylight changes, solar paths, and shadows cast by buildings. This can aid architects and planners in designing structures that maximize natural light.
Personalized Daylight Information
Wearable devices and mobile apps can sync with LED displays to offer personalized daylight data based on individual location and preferences. This integration promotes health-conscious behaviors and efficient energy use.
Conclusion
Length of daylight charts are powerful tools for understanding the natural rhythms of sunlight throughout the year. When combined with LED display technology, they become even more accessible and actionable, serving a broad spectrum of industries and communities.
From agriculture and renewable energy to urban planning and health, LED displays presenting daylight data facilitate informed decision-making and enhance awareness of the environment. As technology advances, these displays will become increasingly sophisticated, offering richer insights and greater interactivity.
Embracing LED-based length of daylight charts is a step toward smarter, more sustainable living, grounded in an appreciation of the natural cycles that shape daily life.
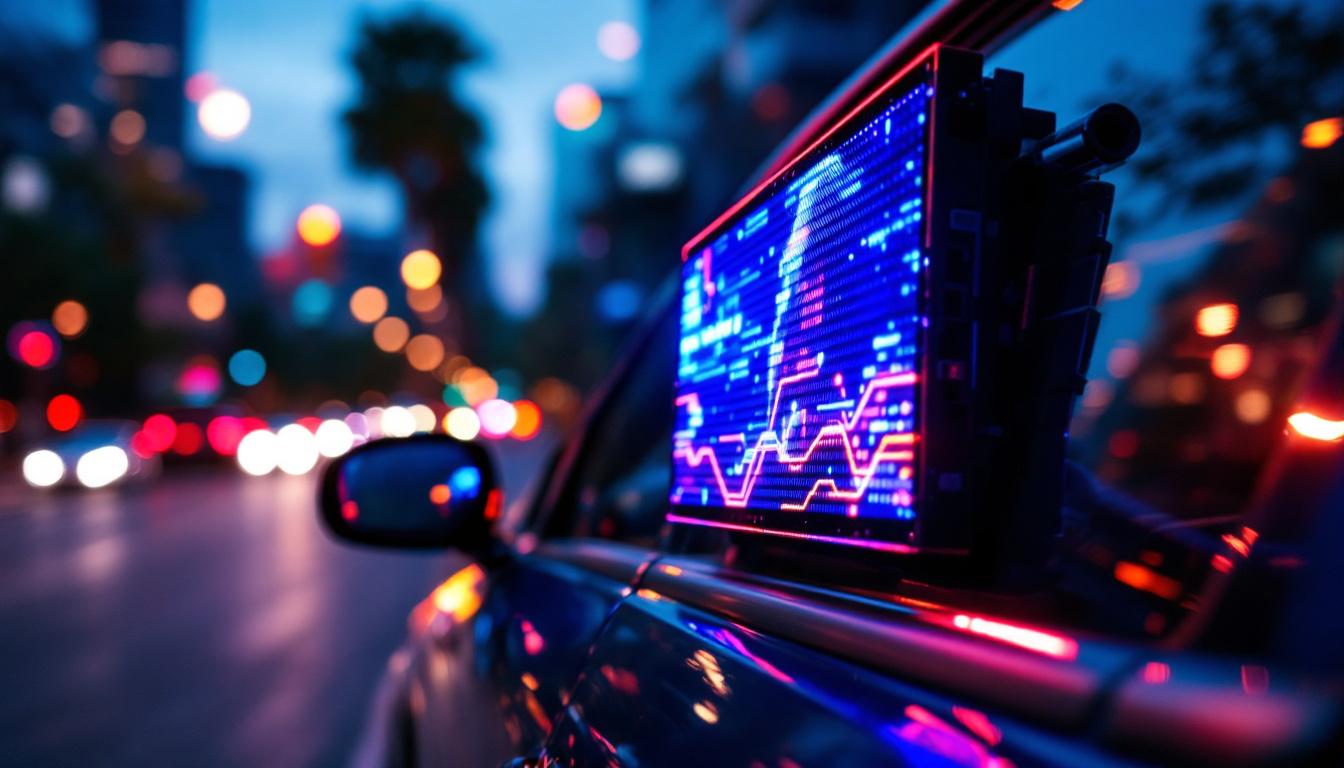
Illuminate Your Space with LumenMatrix
As you consider the importance of daylight patterns and the potential of LED technology to enhance your understanding and interaction with natural cycles, LumenMatrix invites you to explore our innovative LED display solutions. Our range of products, including Indoor and Outdoor LED Wall Displays, Vehicle LED Displays, and more, are designed to transform your space with vibrant, energy-efficient visuals. Whether for urban planning, agriculture, or public information, our LED solutions offer unparalleled clarity and engagement. Check out LumenMatrix LED Display Solutions today and take the first step towards a brighter, more informed future.